


What Is Range?
The range is a measure of the spread or dispersion of a set of values. It provides a simple way to understand the extent of variation in your data.
Definition of Range
In statistics, the range is the difference between the highest and lowest values in a dataset. It’s calculated using the formula:
Range=Maximum Value−Minimum Value\text{Range} = \text{Maximum Value} – \text{Minimum Value}
Why Is Range Important?
Understanding the range helps in:
- Data Analysis: Provides insight into the variability within a dataset.
- Decision Making: Assists in evaluating risk or uncertainty.
- Comparisons: Helps in comparing datasets with different spreads.
How to Find Range: Step-by-Step Guide
Finding the range involves a straightforward process. Here’s a step-by-step guide:
1. Collect Your Data
Gather all the values you need to analyze. This could be how to find range a list of numbers, measurements, or any set of quantitative data.
2. Identify the Maximum Value
Determine the highest value in your dataset. This is your maximum value.
3. Identify the Minimum Value
Determine the lowest value in your dataset. This is your minimum value.
4. Apply the Range Formula
Subtract the minimum value from the maximum value:
Range=Maximum Value−Minimum Value\text{Range} = \text{Maximum Value} – \text{Minimum Value}
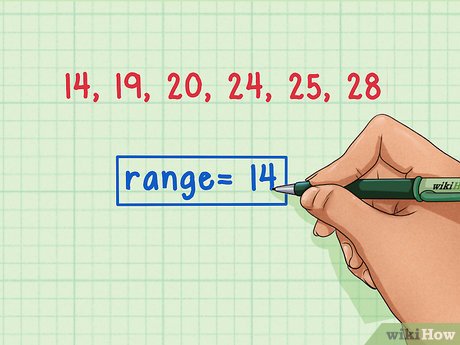
Example Calculation
Suppose you have the following set of numbers: 3, 7, 8, 2, 5.
- Maximum Value: 8
- Minimum Value: 2
- Range Calculation: 8−2=68 – 2 = 6
So, the range of this dataset is 6.
Types of Range
Different contexts might require different methods for finding the range. Here are a few examples:
1. Range in Statistics
As described, it’s the difference between the maximum and minimum values in a dataset.
2. Range in Mathematics
In mathematics, the range can also refer to the set of all possible output values of a function.
3. Range in Everyday Life
For practical purposes, such as determining the range of temperatures in a week or the price range of products, the basic principle remains the same.
Applications of Range
1. Data Analysis
In data analysis, the range helps to understand the spread of values and identify outliers.
2. Risk Assessment
In financial contexts, the range can indicate the potential volatility of an investment.
3. Quality Control
Manufacturers use the range to ensure product consistency and identify variations in production.
Common Misconceptions
1. Range vs. Variance
The range only considers the extremes (maximum and minimum), whereas variance measures the spread of all data points around the mean.
2. Sensitivity to Outliers
The range can be heavily influenced by outliers, which can skew the results if not properly accounted for.
How to Interpret the Range
1. Large Range
A large range indicates high variability in the data, which might suggest inconsistency or diversity in the dataset.
2. Small Range
A small range suggests that the values are closely clustered around the central value, indicating consistency.
Visualizing the Range
Using graphs like box plots can help visualize the range and spread of your data more effectively.
Practical Tips for Finding Range
1. Double-Check Your Data
Ensure accuracy by rechecking the maximum and minimum values.
2. Use Technology
Spreadsheet software like Excel or Google Sheets can quickly calculate the range using built-in functions.
3. Consider Data Context
Understand the context of your data to interpret the range meaningfully.
Conclusion
Finding the range is a straightforward yet powerful tool in data analysis and everyday problem-solving. By understanding how to calculate and interpret the range, you can gain valuable insights into the variability and distribution of your data. Whether you’re analyzing statistical data or making everyday decisions, knowing the range helps you make more informed and accurate conclusions.


